Skip to content


Penguin Random House
Atlas of Science - Visualizing What We Know
Atlas of Science - Visualizing What We Know
Couldn't load pickup availability
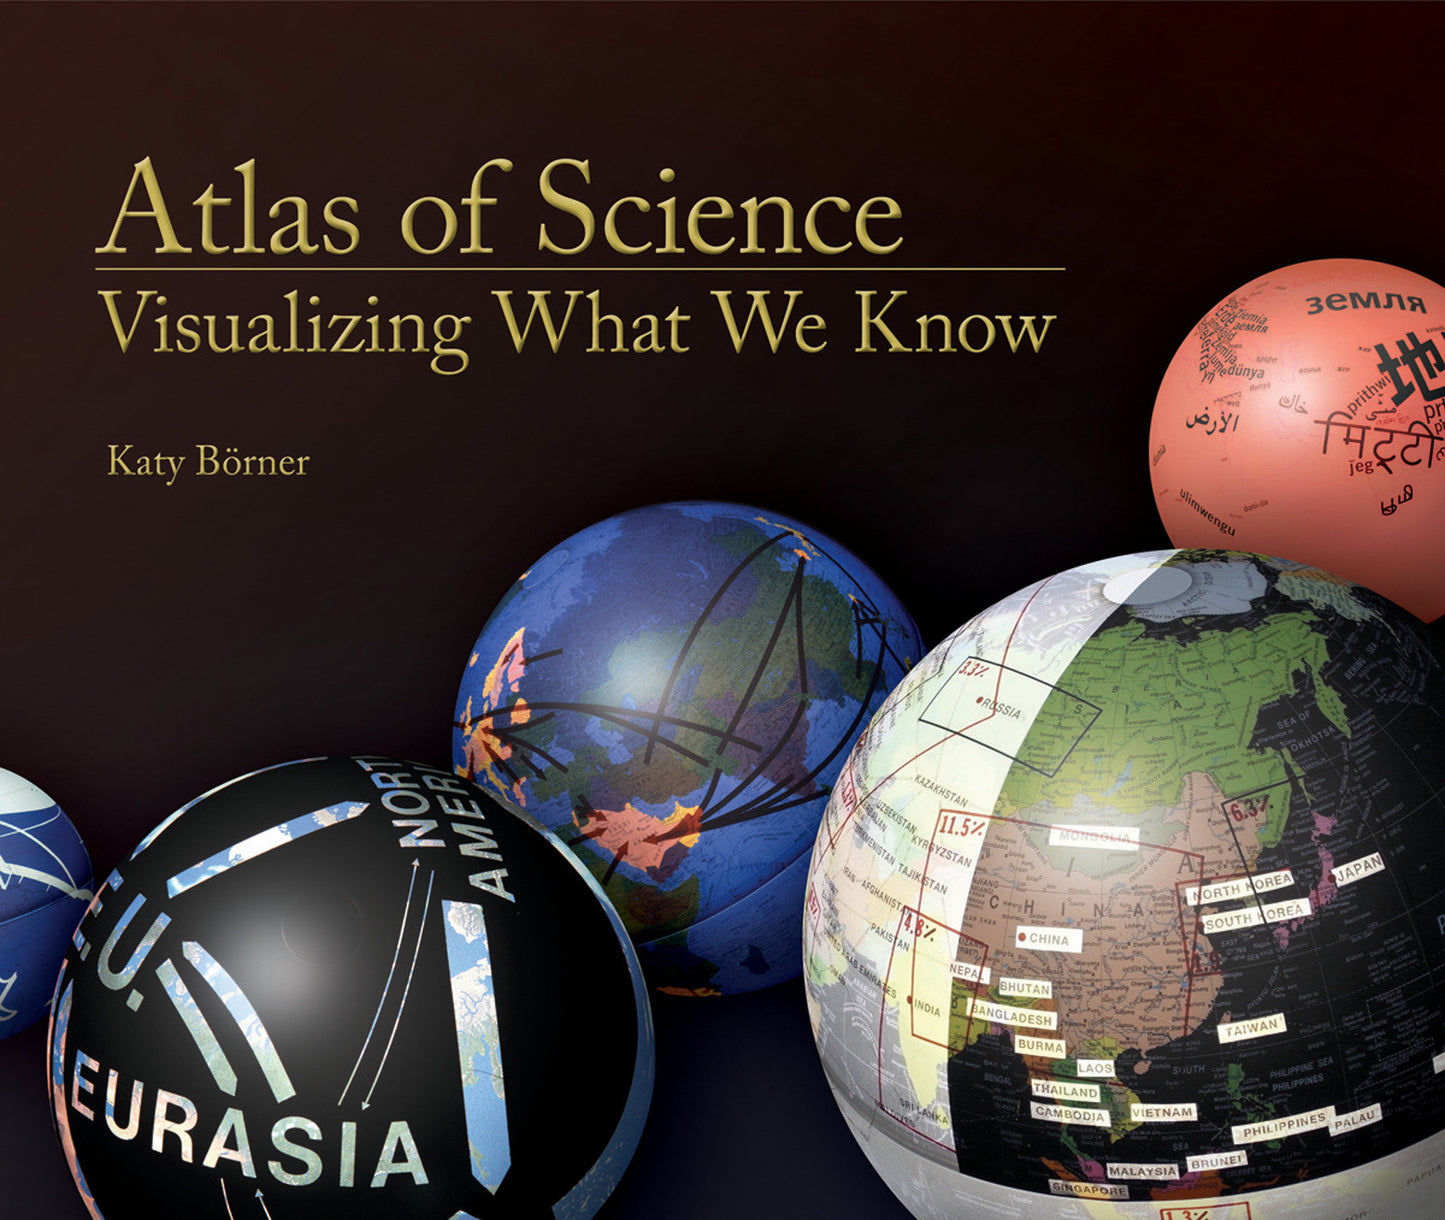
Cartographic maps have guided our explorations for centuries, allowing us to navigate the world. Science maps have the potential to guide our search for knowledge in the same way, allowing us to visualize scientific results. Science maps help us navigate, understand, and communicate the dynamic and changing structure of science and technology—help us make sense of the avalanche of data generated by scientific research today. Atlas of Science, featuring more than thirty full-page science maps, fifty data charts, a timeline of science-mapping milestones, and 500 color images, serves as a sumptuous visual index to the evolution of modern science and as an introduction to “the science of science”—charting the trajectory from scientific concept to published results.
Atlas of Science, based on the popular exhibit, “Places & Spaces: Mapping Science”, describes and displays successful mapping techniques. The heart of the book is a visual feast: Claudius Ptolemy's Cosmographia World Map from 1482; a guide to a PhD thesis that resembles a subway map; “the structure of science” as revealed in a map of citation relationships in papers published in 2002; a visual periodic table; a history flow visualization of the Wikipedia article on abortion; a globe showing the worldwide distribution of patents; a forecast of earthquake risk; hands-on science maps for kids; and many more. Each entry includes the story behind the map and biographies of its makers.
Not even the most brilliant minds can keep up with today's deluge of scientific results. Science maps show us the landscape of what we know.